- Lab Notes
- Analytics
- GA4
- GTM
- Debugging
GA4 Says No Data Received. Here Is the First Thing to Check.
My analytics collected nothing while every tag looked correctly installed. The cause took 30 seconds to find once I knew where to look. A documented diagnostic.
If GA4 is showing you "No data received in past 48 hours" and your tag looks properly installed, check this before anything else:
Go to Admin, then Data streams, then click your stream. Compare the measurement ID shown there against the one in your website code.
If they don't match, that is your bug (in my case, they didn't), and you can stop reading.
I did not catch that on my own site for a long time. This is a side project, so it did not get the TLC and rigor a typical account would. This is the write-up.
What happened
Analytics on this site collected nothing. Not partial data, not sampled data. ZERO.
I cannot tell you exactly how long, and that is worth stating plainly rather than estimating. I never figured out the start date and honestly didn't prioritize it, given that this is my side project and I need it to fix it as soon as I can.
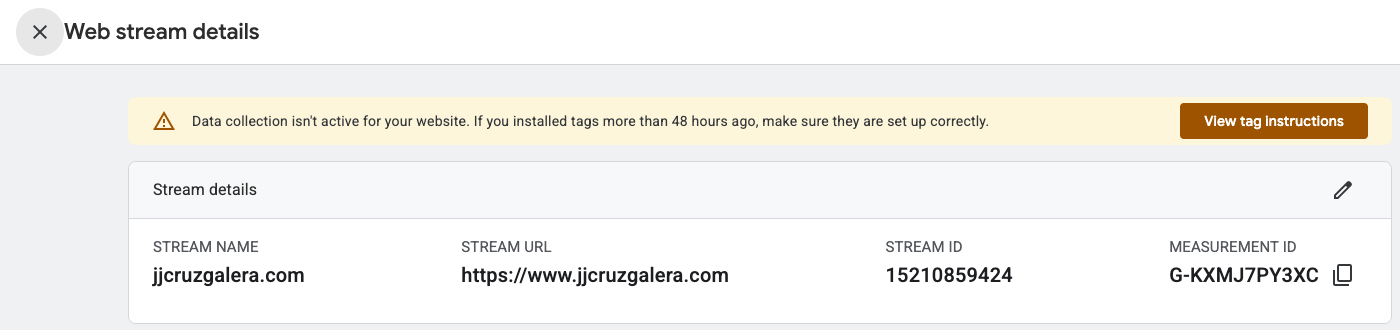
The cause was that the site was sending data to G-MFDXK7KDGR while my GA4 property had actually issued G-KXMJ7PY3XC. Wrong ID, so the data went nowhere, or as they say it in Spain, "to where Jesus lost his hat".
I didn't have the bandwidth to check because I was building a new tool. The site was live, the tags were installed, and nothing surfaced a problem until I opened GA4 for an unrelated reason and found an empty property.

Why it was invisible
This is the part worth your time, because the setup looked healthy by every check I would normally run:
- The Tag Manager container was on the page and published
- The Google tag script loaded fine, status 200
- Tracking requests fired on every page load and came back successful
That third one is the trap. My Google tag was configured for two destinations, GA4 and Google Ads. The Google Ads half worked perfectly. So when I looked at the network activity and saw successful tracking requests, I concluded the tag was working and went looking somewhere else.
In reality, half the tag was working. That is worse than none of it working, because it produces a convincing all-clear.
How I actually found it
Four questions, in order. Each one rules out a whole category of cause.
Is the tag really on the live page?
Not in your repo, on the live page. A branch that never merged and a build step that strips a script look identical to a tag you forgot to install. I checked the delivered source directly.
It was there.
Do tracking requests leave the browser?
Open Chrome DevTools with Cmd + Option + I, click Network, type collect in the filter box, then hard reload with Cmd + Shift + R.
If nothing shows up, something on the browser side is blocking it: an ad blocker, an extension, a consent banner. If requests do show up, your data is leaving the machine and the problem is further down the line.
Mine showed two requests, both successful.
Where are those requests going?
This is the question I would have skipped in a hurry, and it is the one that cracked it.
A request coming back successful does not mean it went to the right place. Those are two different claims, and I had quietly collapsed them into one.
Every tracking request carries a tid parameter naming its destination. Click any request and read the URL. Mine both said tid=AW-857388779, a Google Ads ID. Neither was GA4.
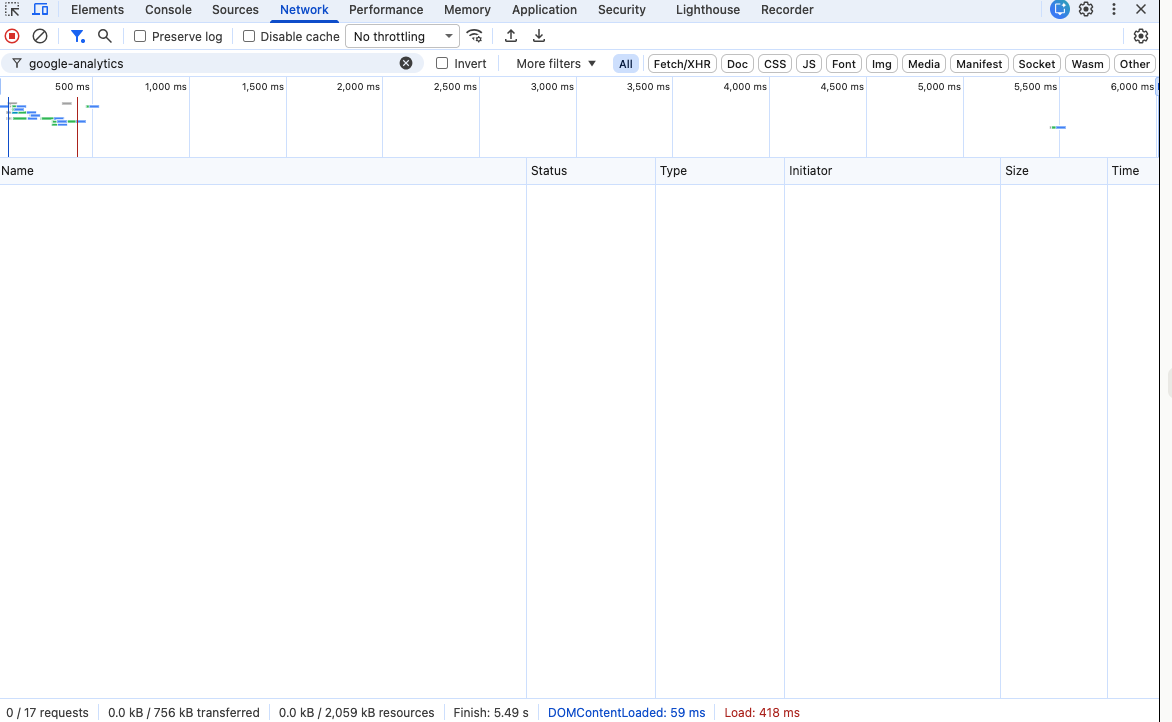
Then I changed the filter from collect to google-analytics and reloaded. Zero results, out of 17 total requests on the page.
No GA4 request was being made at all. Not a failing one. None.
So why was it never sent?
One red row in the network panel had the answer:
googletagmanager.com/gtag/destination?id=G-MFDXK7KDGR
404 Not Found
The response came back from Google's own servers, so nothing was blocking it. Google was asked for the setup belonging to that measurement ID and replied that no such thing exists. Without that setup, the GA4 side of the tag never starts, so it never sends anything.
At that point, I opened the GA4 data stream panel, read the correct measurement ID, and saw it didn't match.
Fixing it
In Tag Manager. I updated the measurement ID on the Google tag, checked the five event tags, then hit Submit and Publish (you can and should Preview it before committing). Publishing is not a formality. Until you publish, your changes do not exist on the live site.
In the code. The site also had a second GA4 snippet hardcoded into the layout file, carrying the same wrong ID. Once the container was fixed, that snippet would have caused double counting, so I removed it and left Tag Manager as the only source.
Order matters. Fix the path you want to keep, confirm it works, then delete the redundant one. Doing it the other way round risks deleting the thing that was about to start working.
Confirm it worked. Reload with the network panel filtered to google-analytics. You want to see a request that was not there before, carrying your correct ID. Then check GA4 Realtime and look for yourself. To QA leverage, use Realtime. The banners on the admin screens lag, so they will keep saying "no data" for a while after you have fixed it.
The bug hiding behind the fix
"Now, you see, you've gone and ruined a perfectly good vibe." – The Gentlemen
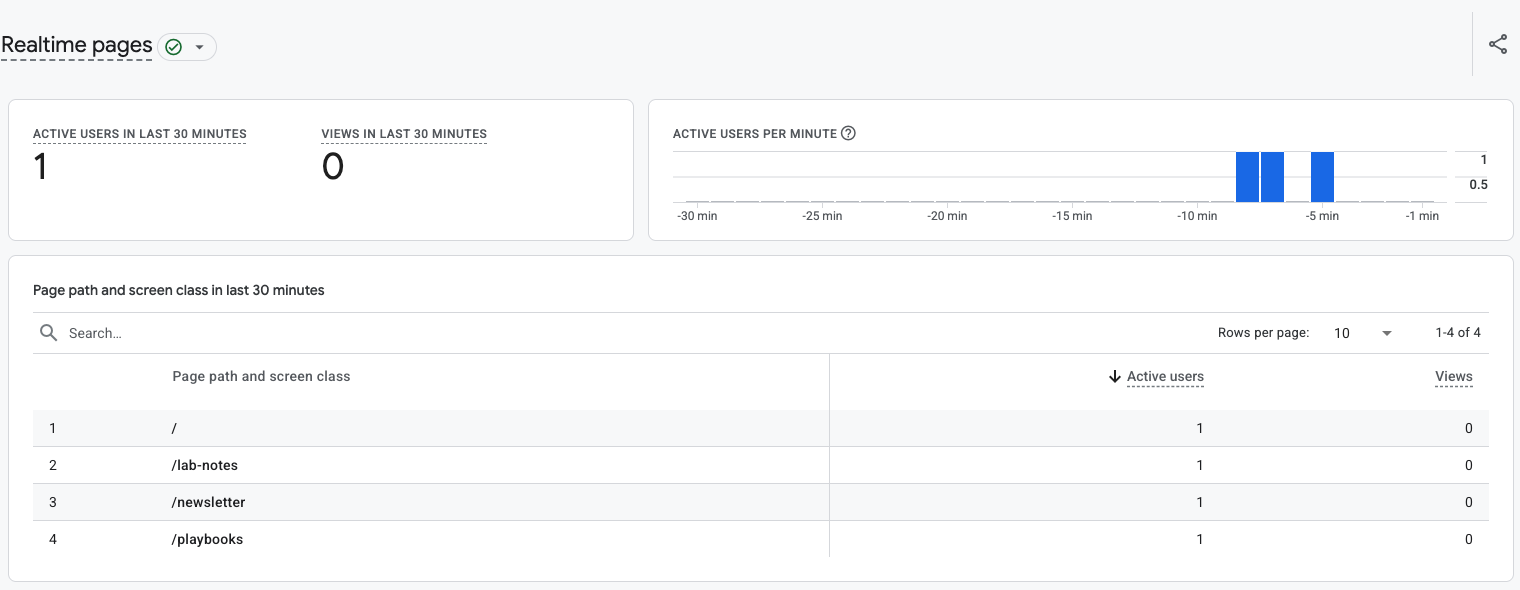
A few days later I opened Realtime expecting a clean bill of health. Users were showing up. Events were firing. And one card read "No data available." At this point my angst fully kicked in.
It was the card showing which pages people were viewing…
The answer was in the card next to it, which lists every event GA4 has received. It showed scroll_depth, user_engagement and session_start, and at the bottom it said "1 to 3 of 3." Three events, and that was all of them.
No page_view. GA4 knew people were on my site and knew they were scrolling. It had no record of them viewing a page. So the page title card had nothing to show, exactly as designed.
The cause was one incredibly simple setting in Tag Manager. On the Google tag, send_page_view was set to false. That switch stops the automatic pageview while leaving every other event untouched. Change it to true, submit (did not have the patience to preview), and publish, and page_view starts firing immediately.
Look at the shape of that failure. Correct measurement ID. Requests firing. Realtime populated. Users counted. Every headline number reading healthy, and the most basic measurement in analytics missing entirely. The only clue was a card that looked like it had not finished loading.
I spent a week fixing a silent failure, and another one was sitting underneath it.
Check your own setup in ten seconds.
Go to Realtime and find the "Event count by event name" card. If page_view is not in the list, you have this bug. Then check Tag Manager for a send_page_view parameter set to false.
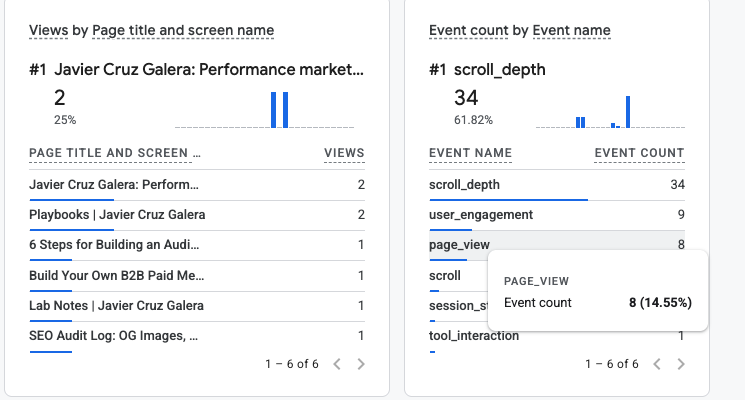
While I was in there, I also found scroll and scroll_depth both firing. The first is GA4's built-in scroll tracking, which fires once at 90%. The second is my own Tag Manager tag firing at 10, 25, 50, 75, and 100 (I created this one to optimize my audience targeting). Not broken, but they double-report, so it is worth picking one before you build anything on top of it.
What I lost
The GA4 data is gone for goooood. The requests were never sent, so there is nothing to reprocess and no backfill to run. Every session, pageview, and custom event from that window simply does not exist.
What survived, because it never touched GA4:
- Search Console. Completely separate system, unaffected, and honestly the more important dataset for a site running an SEO experiment. All the clicks, impressions, positions, and queries are intact.
- Google Ads. Working the whole time, as established.
Search Console holds 16 months of performance data, then deletes it permanently. Since it is now my only record of this period, I can export it to CSV and put a monthly reminder in the calendar. If you are thinking of turning on the BigQuery export instead, know that it only saves data from the day you switch it on. Unfortunately, it doesn't reach backward.
The takeaway
Verify the measurement ID against the GA4 data stream panel before you debug anything else. It takes half a minute, and it would have saved me every other step in this post.
Come back to each update and check it 24 and 48 hours after implementation!
Note on the 404: my explanation of why a failed configuration request prevents the tracking request is my reading of the behavior, not something I confirmed in Google's documentation. The 404 itself, and the ID mismatch behind it, are directly observed.
Open items
- Monthly Search Console CSV export, now scheduled
- Re-baselining GA4 from August 28, 2026, since the property has no history before it